Discussion
Loading...

Post

  • About
  • Code of conduct
  • Privacy
  • About Bonfire
Ross of Ottawa
@ottaross@mastodon.social  ·  activity timestamp 6 days ago

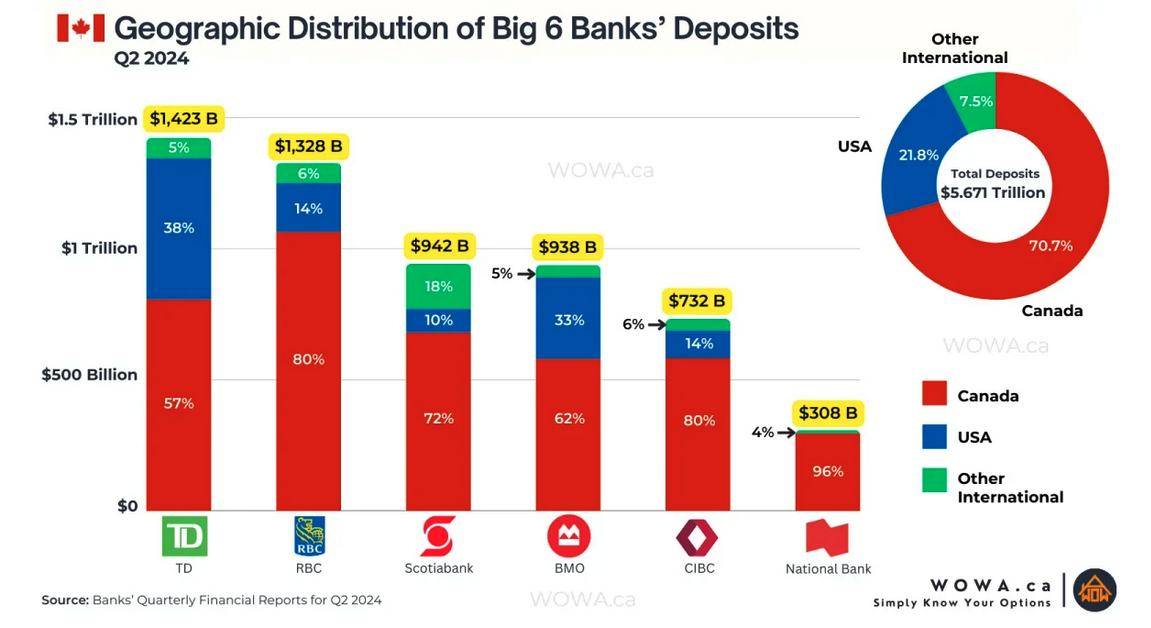
In case you're interested in the state of the Canadian banking landscape and geographic exposure, I just came across this chart, which seems useful that way.

All of them nickle and diming us on fees and services of course, but if you're worried about your savings and which bank is most exposed to the kleptocracy south of the border, TD is the worst and National the best, against that broad measure.

#Canada #banking #investing.

A detailled stacked bar chart of the big six Canadian banks and their geographic exposure, broken down into Canadian deposits versus US, and other international exposure.  Lots of detail on there, but to highlight some elements of it, All the banks are primarily focussed on Canadian deposits still, though TD bank has 38% exposure to US deposits and at the opposite end National Bank has only less than visible exposure on the chart, so likely less than 1%.  

For other international exposure the extremes are Scotiabank with 18% and National again with 4%. 

Total assets are TD as the biggest with 1.5 Trillion and National the smallest at 308 Billion dollars. 

Date on the graph is Q2 2024
A detailled stacked bar chart of the big six Canadian banks and their geographic exposure, broken down into Canadian deposits versus US, and other international exposure. Lots of detail on there, but to highlight some elements of it, All the banks are primarily focussed on Canadian deposits still, though TD bank has 38% exposure to US deposits and at the opposite end National Bank has only less than visible exposure on the chart, so likely less than 1%. For other international exposure the extremes are Scotiabank with 18% and National again with 4%. Total assets are TD as the biggest with 1.5 Trillion and National the smallest at 308 Billion dollars. Date on the graph is Q2 2024
  • Copy link
  • Flag this post
  • Block
Log in

Bonfire Dinteg Labs

This is a bonfire demo instance for testing purposes. This is not a production site. There are no backups for now. Data, including profiles may be wiped without notice. No service or other guarantees expressed or implied.

Bonfire Dinteg Labs: About · Code of conduct · Privacy ·
Bonfire social · 1.0.0 no JS en
Automatic federation enabled
  • Explore
  • About
  • Code of Conduct
Home
Login