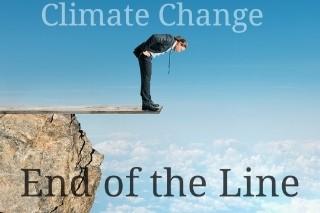
GIVE MOTHER EARTH A BREAK!
"Trump won't do it, but we can!
In response to the war in Iran, I pledge to use 20% less oil to offset the Strait of Hormuz blockade.
Who knows, the planet you save might be your own!“
- Aure
#AureFreePress #News #press #GlobalWarming #climatechange #climatecrisis