C.H. Romatowski
@chromatowski.bsky.social
Follow back
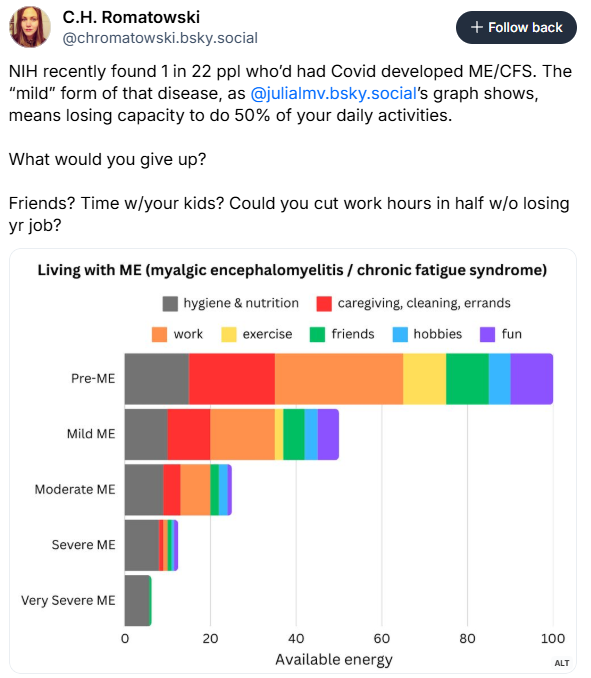
NIH recently found 1 in 22 ppl who’d had Covid developed ME/CFS. The “mild” form of that disease, as
@julialmv.bsky.social
’s graph shows, means losing capacity to do 50% of your daily activities. What would you give up? Friends? Time w/your kids? Could you cut work hours in half w/o losing yr job?
A stacked bar chart (oriented horizontally) labeled: Living with ME (myalgic encephalomyelitis / chronic fatigue syndrome) Each horizontal bar is a disease status: Pre-ME, Mild ME, Moderate ME, Severe ME, Very Severe ME. The width of each bar represents how much energy is available in each status (100, 50, 25, 12.5, and 6.25 respectively). Each bar is divided into sections for how one might allocate their energy: hygiene & nutrition (gray); caregiving, cleaning errands (red); work (orange); exercise (yellow); friends (green); hobbies (blue); fun (purple). With worsening ME, the hygiene & nutrition takes up a larger proportion of total available energy and the amount of energy available for all other parts of life shrinks. Mild ME has most things cut in half, with exercise cut smaller. Moderate ME removes exercise altogether, and everything else shrinks. Severe ME has only tiny slivers of red, orange, green, blue and purple. Very Severe ME has only a tiny sliver of green.